KUON GEO › Learn › Equal Earth
The Equal Earth projection,explained with numbers.
On 4 September 2026 the United Nations General Assembly recommended that world maps use the Equal Earth projection instead of Mercator. This page explains what that means: what the projection keeps, what it gives up, why Greenland has looked the size of Africa for four centuries, and how to see it for yourself on a map you can rotate, compare and measure.
Open the interactive mapfree · no account · runs in your browser
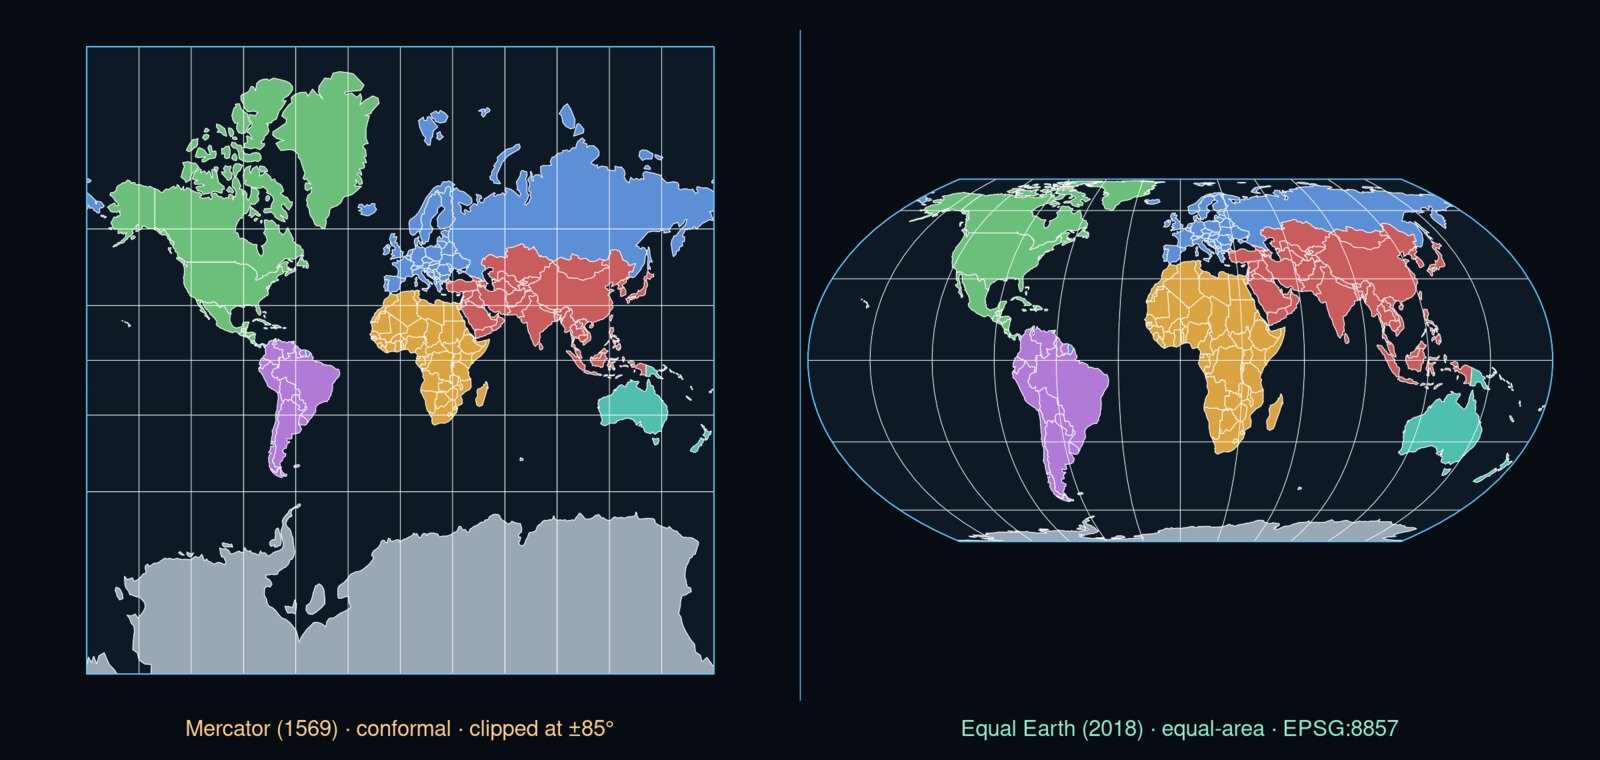
An equal-area map that still looks like a map.
Equal Earth is a pseudocylindrical, equal-area projection of the whole Earth. Equal-area means that any two regions on the map have the same ratio of areas as on the globe: if Africa is fourteen times Greenland on the ground, it is fourteen times Greenland on the paper. Pseudocylindrical means the parallels are straight horizontal lines and the meridians are gentle curves, which is why it reads as a familiar world map rather than a diagram.
It was published in 2018 by Bojan Šavrič of Esri, Tom Patterson of the US National Park Service and Bernhard Jenny of Monash University, in the International Journal of Geographical Information Science. Their aim, in their own words, was a projection with the visual appeal of the Robinson projection that is strictly equal-area. Earlier equal-area maps existed; none had been widely liked.
Within months it was added to PROJ, the open-source library that nearly every mapping program uses for coordinate transformations, and from there to QGIS, GDAL, ArcGIS, D3 and Python's Cartopy. It has three registered coordinate reference systems: EPSG:8857 centred on Greenwich, EPSG:8858 centred on the Americas, and EPSG:8859 centred on the Asia-Pacific.
What the United Nations decided.
The General Assembly adopted a resolution recommending Equal Earth for world maps in place of Mercator. 164 member states voted in favour, Japan among them. One voted against: the United States. Six abstained. The resolution was introduced by Togo and grew out of the Correct The Map campaign, backed by the African Union, which argued that the Mercator classroom map had made Africa look smaller than it is for a hundred years. According to Reuters, the United States called the resolution ideological and said it did not serve international peace.
A General Assembly resolution is a recommendation. It does not oblige any publisher or school to change a map. What it changes is the default: a world map in Mercator is now a choice that has to be defended, rather than the way things have always been done.
It was built for ships, and it inflates area by 1/cos²φ.
Gerardus Mercator drew his map in 1569 so that a constant compass bearing would be a straight line. That single property made it the navigator's chart for four centuries, and it is why every web map tile today uses Web Mercator: when you zoom into a street, shapes are right and north is up. The trouble begins only when the same projection is used to show the whole world at once.
The mathematics that keeps bearings straight stretches the map by 1/cos φ in both directions at latitude φ, so area grows by 1/cos²φ. The table gives the factor by latitude. Integrated over real country outlines, Mercator draws Japan at about 1.6 times its true relative area, the United Kingdom at 2.9, Canada at 5.2, Norway at 9.4 and Greenland at 16.5, while Africa, which sits on the equator, comes out at 1.1. Greenland is 2.15 million km². Africa is 30 million km². On Mercator they look the same.
| Latitude | Area factor in Mercator |
|---|---|
| 0° | × 1.00 |
| 30° | × 1.33 |
| 35° | × 1.49 |
| 45° | × 2.00 |
| 60° | × 4.00 |
| 70° | × 8.55 |
| 80° | × 33.2 |
Japan lies around 35°N; Hokkaido around 43°N, where the factor is 1.9. The poles cannot be drawn at all; web maps stop at 85.05°.
Gall-Peters, Mollweide, Robinson, Winkel Tripel.
Equal-area maps are not new. Lambert described one in 1772, Mollweide in 1805, Gall in 1855. In 1973 Arno Peters promoted Gall's projection as a corrective to the Eurocentric world map, and the Gall-Peters map became famous, and disliked, for its tall, stretched continents. In 1989 seven North American geographic organisations resolved that rectangular world maps should not be used at all.
The compromise projections filled the gap: Robinson from 1963, used by the National Geographic Society from 1988, and Winkel Tripel, which replaced it in 1998. They look natural. They are not equal-area. Robinson still draws Greenland about twice its true relative size. Equal Earth is the first projection that is both strictly equal-area and, to most eyes, as pleasant as Robinson. The interactive map lets you switch between all of them and watch the same country outlines change.
Four coefficients, and a check you can run yourself.
With longitude λ and latitude φ in radians, define an auxiliary latitude by sin θ = (√3 / 2) sin φ. Then y = A₁θ + A₂θ³ + A₃θ⁷ + A₄θ⁹ and x = (2√3 / 3) λ cos θ divided by the derivative of y, with A₁ = 1.340264, A₂ = −0.081106, A₃ = 0.000893 and A₄ = 0.003796. Dividing x by the derivative of y is what makes the area exact: wherever the map is squeezed vertically it is stretched horizontally by the same factor. The inverse is solved by Newton's method. That is the whole projection, and it fits in twenty lines of code.
We do not ask you to take equal-area on trust. This site integrates the area scale of the projection over the whole globe on a 720 by 720 grid every time it is built: the result is 12.56638058 against 4π = 12.56637061, a relative difference of 7.9 × 10⁻⁷, which is the grid and nothing else. The map page has a Verify button that runs the same integration in your browser, and you can run it on Mercator to watch it fail. The full derivation, with the history and the practical steps, is in map projections, explained.
Not a picture of a projection. A tool for measuring one.
- Seven projections on the same outlines: Equal Earth, Mercator, plate carrée, Mollweide, Gall-Peters, Robinson and Winkel Tripel, with side-by-side comparison.
- Rotate the globe by dragging, in longitude and latitude, and zoom with the wheel. Presets for EPSG:8857, 8858, 8859 and a Japan-centred view.
- Click any country: its area from the Natural Earth 1:50m outline integrated on the sphere, and how many times larger Mercator draws it. Click a second country and read the true ratio next to the Mercator ratio.
- Tissot's indicatrices, the day-night line computed for the current minute, a colour scale of Mercator exaggeration, and the 2,400 public RTK base stations that KUON GEO polls every ten minutes.
- Export as PNG at 2× or 4× or as SVG with every country as a labelled vector path, and a link that reproduces the exact view.
- Verify equal-area numerically in the browser. The map draws from a 1:110m source and does not zoom past what the source can support.
Using Equal Earth in QGIS, PROJ and Python.
In QGIS, open Project, Properties, CRS, type 8857 and choose WGS 84 / Equal Earth Greenwich; the layers reproject on the fly. On the command line the PROJ string is +proj=eqearth +lon_0=0 +datum=WGS84 +units=m, and a raster is reprojected with gdalwarp -t_srs EPSG:8857. In Python, pyproj's Transformer.from_crs("EPSG:4326", "EPSG:8857", always_xy=True) does the same. D3 has d3.geoEqualEarth() built in.
One caution that applies to every equal-area map: do not measure distances on it. For survey and positioning use a conformal local system such as UTM or, in Japan, the plane rectangular coordinate system explained in coordinates and height.
Questions people ask
What is the Equal Earth projection in one sentence?
An equal-area world map projection from 2018 in which every region keeps its true relative size, shaped to look like a conventional world map rather than a stretched rectangle.
What did the UN decide on 4 September 2026?
The General Assembly adopted a resolution recommending Equal Earth for world maps in place of Mercator: 164 in favour, 1 against (the United States), 6 abstentions. It is a recommendation, not a binding rule.
Why did the United States vote against?
According to Reuters, the United States said the resolution was ideological and did not serve international peace. No technical objection to the projection itself was reported.
Is the Mercator projection wrong?
No. It is conformal, which is what a navigation chart and a zoomable street map need. It is unsuitable for comparing the size of countries on a whole-world map, because area grows by 1/cos²φ toward the poles: 4 times at 60°, 33 times at 80°.
How much bigger does Mercator make Greenland?
Integrated over its outline, about 16.5 times its true relative area. Greenland is 2.15 million km² and Africa 30 million km², a ratio of 1 to 14, yet on Mercator they look about the same.
How is Equal Earth different from Gall-Peters?
Both are equal-area. Gall-Peters is cylindrical, so the map is a rectangle and the continents are stretched tall near the equator and flattened near the poles. Equal Earth is pseudocylindrical with curved meridians and a rounded outline, which distributes the shape distortion more gently.
How do I use Equal Earth in QGIS?
Project, Properties, CRS, filter for 8857, select WGS 84 / Equal Earth Greenwich. For an Asia-Pacific-centred map choose EPSG:8859, for the Americas EPSG:8858.
Is this map free?
Yes, with no account. Outlines are Natural Earth (public domain); the projection is the published 2018 formula; the code runs in your browser.
Every country
The same page for each of the 177 countries in the dataset, in seven languages.
Africa
Democratic Republic of the Congo ×1.0Algeria ×1.3Sudan ×1.1Libya ×1.3Chad ×1.1Mali ×1.1Angola ×1.1South Africa ×1.3Niger ×1.1Ethiopia ×1.0Mauritania ×1.1Egypt ×1.3Tanzania ×1.0Nigeria ×1.0Namibia ×1.2Mozambique ×1.1Zambia ×1.1South Sudan ×1.0Central African Republic ×1.0Kenya ×1.0Madagascar ×1.1Morocco ×1.3Botswana ×1.2Somalia ×1.0Cameroon ×1.0Zimbabwe ×1.1Republic of the Congo ×1.0Ivory Coast ×1.0Burkina Faso ×1.0Gabon ×1.0Guinea ×1.0Uganda ×1.0Ghana ×1.0Senegal ×1.1Somaliland ×1.0Tunisia ×1.5Eritrea ×1.1Malawi ×1.1Benin ×1.0Liberia ×1.0Western Sahara ×1.2Sierra Leone ×1.0Togo ×1.0Guinea-Bissau ×1.0Lesotho ×1.3Burundi ×1.0Equatorial Guinea ×1.0Rwanda ×1.0Djibouti ×1.0Eswatini ×1.2The Gambia ×1.1Antarctica
Antarctica ×23.5Asia
People's Republic of China ×1.6India ×1.2Kazakhstan ×2.3Saudi Arabia ×1.2Indonesia ×1.0Iran ×1.4Mongolia ×2.1Pakistan ×1.3Turkey ×1.7Myanmar ×1.2Afghanistan ×1.5Thailand ×1.1Turkmenistan ×1.7Yemen ×1.1Uzbekistan ×1.8Iraq ×1.4Japan ×1.6Vietnam ×1.1Malaysia ×1.0Oman ×1.1Philippines ×1.0Laos ×1.1Kyrgyzstan ×1.8Syria ×1.5Cambodia ×1.1Nepal ×1.3Tajikistan ×1.6Bangladesh ×1.2North Korea ×1.7South Korea ×1.5Jordan ×1.4Azerbaijan ×1.7United Arab Emirates ×1.2Georgia ×1.8Sri Lanka ×1.0Bhutan ×1.3Taiwan ×1.2Armenia ×1.7Israel ×1.4Kuwait ×1.3East Timor ×1.0Qatar ×1.2Lebanon ×1.5Palestine ×1.4Cyprus ×1.5Brunei ×1.0Turkish Republic of Northern Cyprus ×1.5Europe
Russia ×4.9France ×2.0Ukraine ×2.3Spain ×1.7Sweden ×4.9Norway ×9.4Germany ×2.5Finland ×5.5Poland ×2.7Italy ×1.9United Kingdom ×2.9Romania ×2.1Belarus ×2.8Greece ×1.7Bulgaria ×1.9Iceland ×5.6Hungary ×2.2Portugal ×1.7Austria ×2.2Czech Republic ×2.4Serbia ×1.9Ireland ×2.8Lithuania ×3.1Latvia ×3.3Croatia ×2.0Bosnia and Herzegovina ×1.9Slovakia ×2.3Estonia ×3.7Denmark ×3.2Switzerland ×2.1Netherlands ×2.7Moldova ×2.2Belgium ×2.5Albania ×1.8North Macedonia ×1.8Slovenia ×2.1Montenegro ×1.9Kosovo ×1.8Luxembourg ×2.4North America
Canada ×5.2United States of America ×2.3Greenland ×16.5Mexico ×1.2Nicaragua ×1.1Honduras ×1.1Cuba ×1.2Guatemala ×1.1Panama ×1.0Costa Rica ×1.0Dominican Republic ×1.1Haiti ×1.1Belize ×1.1El Salvador ×1.1The Bahamas ×1.2Jamaica ×1.1Puerto Rico ×1.1Trinidad and Tobago ×1.0Oceania
Australia ×1.3Papua New Guinea ×1.0New Zealand ×1.8Solomon Islands ×1.0New Caledonia ×1.2Fiji ×1.1Vanuatu ×1.1Open ocean
French Southern and Antarctic Lands ×2.4South America
Brazil ×1.1Argentina ×1.6Peru ×1.0Colombia ×1.0Bolivia ×1.1Venezuela ×1.0Chile ×1.8Paraguay ×1.2Ecuador ×1.0Guyana ×1.0Uruguay ×1.4Suriname ×1.0Falkland Islands ×2.6Now, see it for yourself.
Open the interactive mapEqual Earth: Šavrič, Patterson & Jenny, IJGIS 33(3), 2018, doi 10.1080/13658816.2018.1504949 · Outlines: Natural Earth 1:110m; areas from 1:50m integrated on the sphere · UN vote: reported by Mainichi, Asahi and Reuters, 4 September 2026 · Every image on this page is rendered by this site from that data.